Methods in Computational Neuroscience
Project detailing whole development to completion pipeline of computational research process in macaque monkeys
Premise/Goals
Monte Carlo Stats
This was the culmination of my initial introduction to computational methods focused on and tailored for neuroscience. In this course, I learned a variety of scientific frameworks and tools for observing information and manipulating it to tell an interesting and novel story. In this project, I undergo the entire process of turning a rich dataset into substantive quantitive results and qualitative descriptions and explanations of those results.
I worked with the monkey “maze” dataset from Churchland, Kaufman & Shenoy that has also been used and cited in many other papers (e.g., Churchland 2012, Kaufman 2014). This data consists of a macaque monkey making arm reaches from one point to another after a brief delay period. The monkey had to navigate its arm through a virtual maze present on a screen. Some reaches had the monkey move its arm in a straight motion, whereas others had it move its arm while avoiding barriers on the screen, resulting in curved reaching motions. 158 neurons were simultaneously recorded from the dorsal premotor cortex and primary motor cortex (M1). The behavior recorded into this dataset was extremely well-controlled.
My ultimate goal for this project was to uncover some of the fundamental ways in which motor neuron’s store task-relevant movement information on the basis of target location in the quadrants of a Cartesian Coordinate System. This means I characterized my data based on the target for a given reach into four distinct groups (up and right/up and left/down and left/down and right from the origin point) and observed if there were fundamental shared traits or differences on neural data based on this.
I specifically showcase:
data visualization of both behavioral and neural data
Monte Carlo statistics - in this case, that means I use repeated random sampling of observed neuron types and information to estimate statistics of interest, complex probabilities, and aspects of behavior of the grander motor neuron network I am studying.
Trial to trial variability - otherwise known as Fano Factor in neuroscience, this metric shows how a data/behavior type’s variability changes across time (or some other condition that changes across trials), and shows that time/this condition affects some underlying process that is relevant to the behavior.
Classifiers - Classifying the the type of movement (which quadrant the reach went into, or whether the reach was straight or curved) purely based off of the neural data of that trial, and how hypothetical trials generated using taken neural data would be classified.
Clustering/nonlinear dimensionality reduction - Seeing if algorithms that cluster neural data together can reveal traits about the behavior of the data, such as the neural data being a reach into the same quadrant, or the reach being performed after a longer than average delay period.
Data Visualization
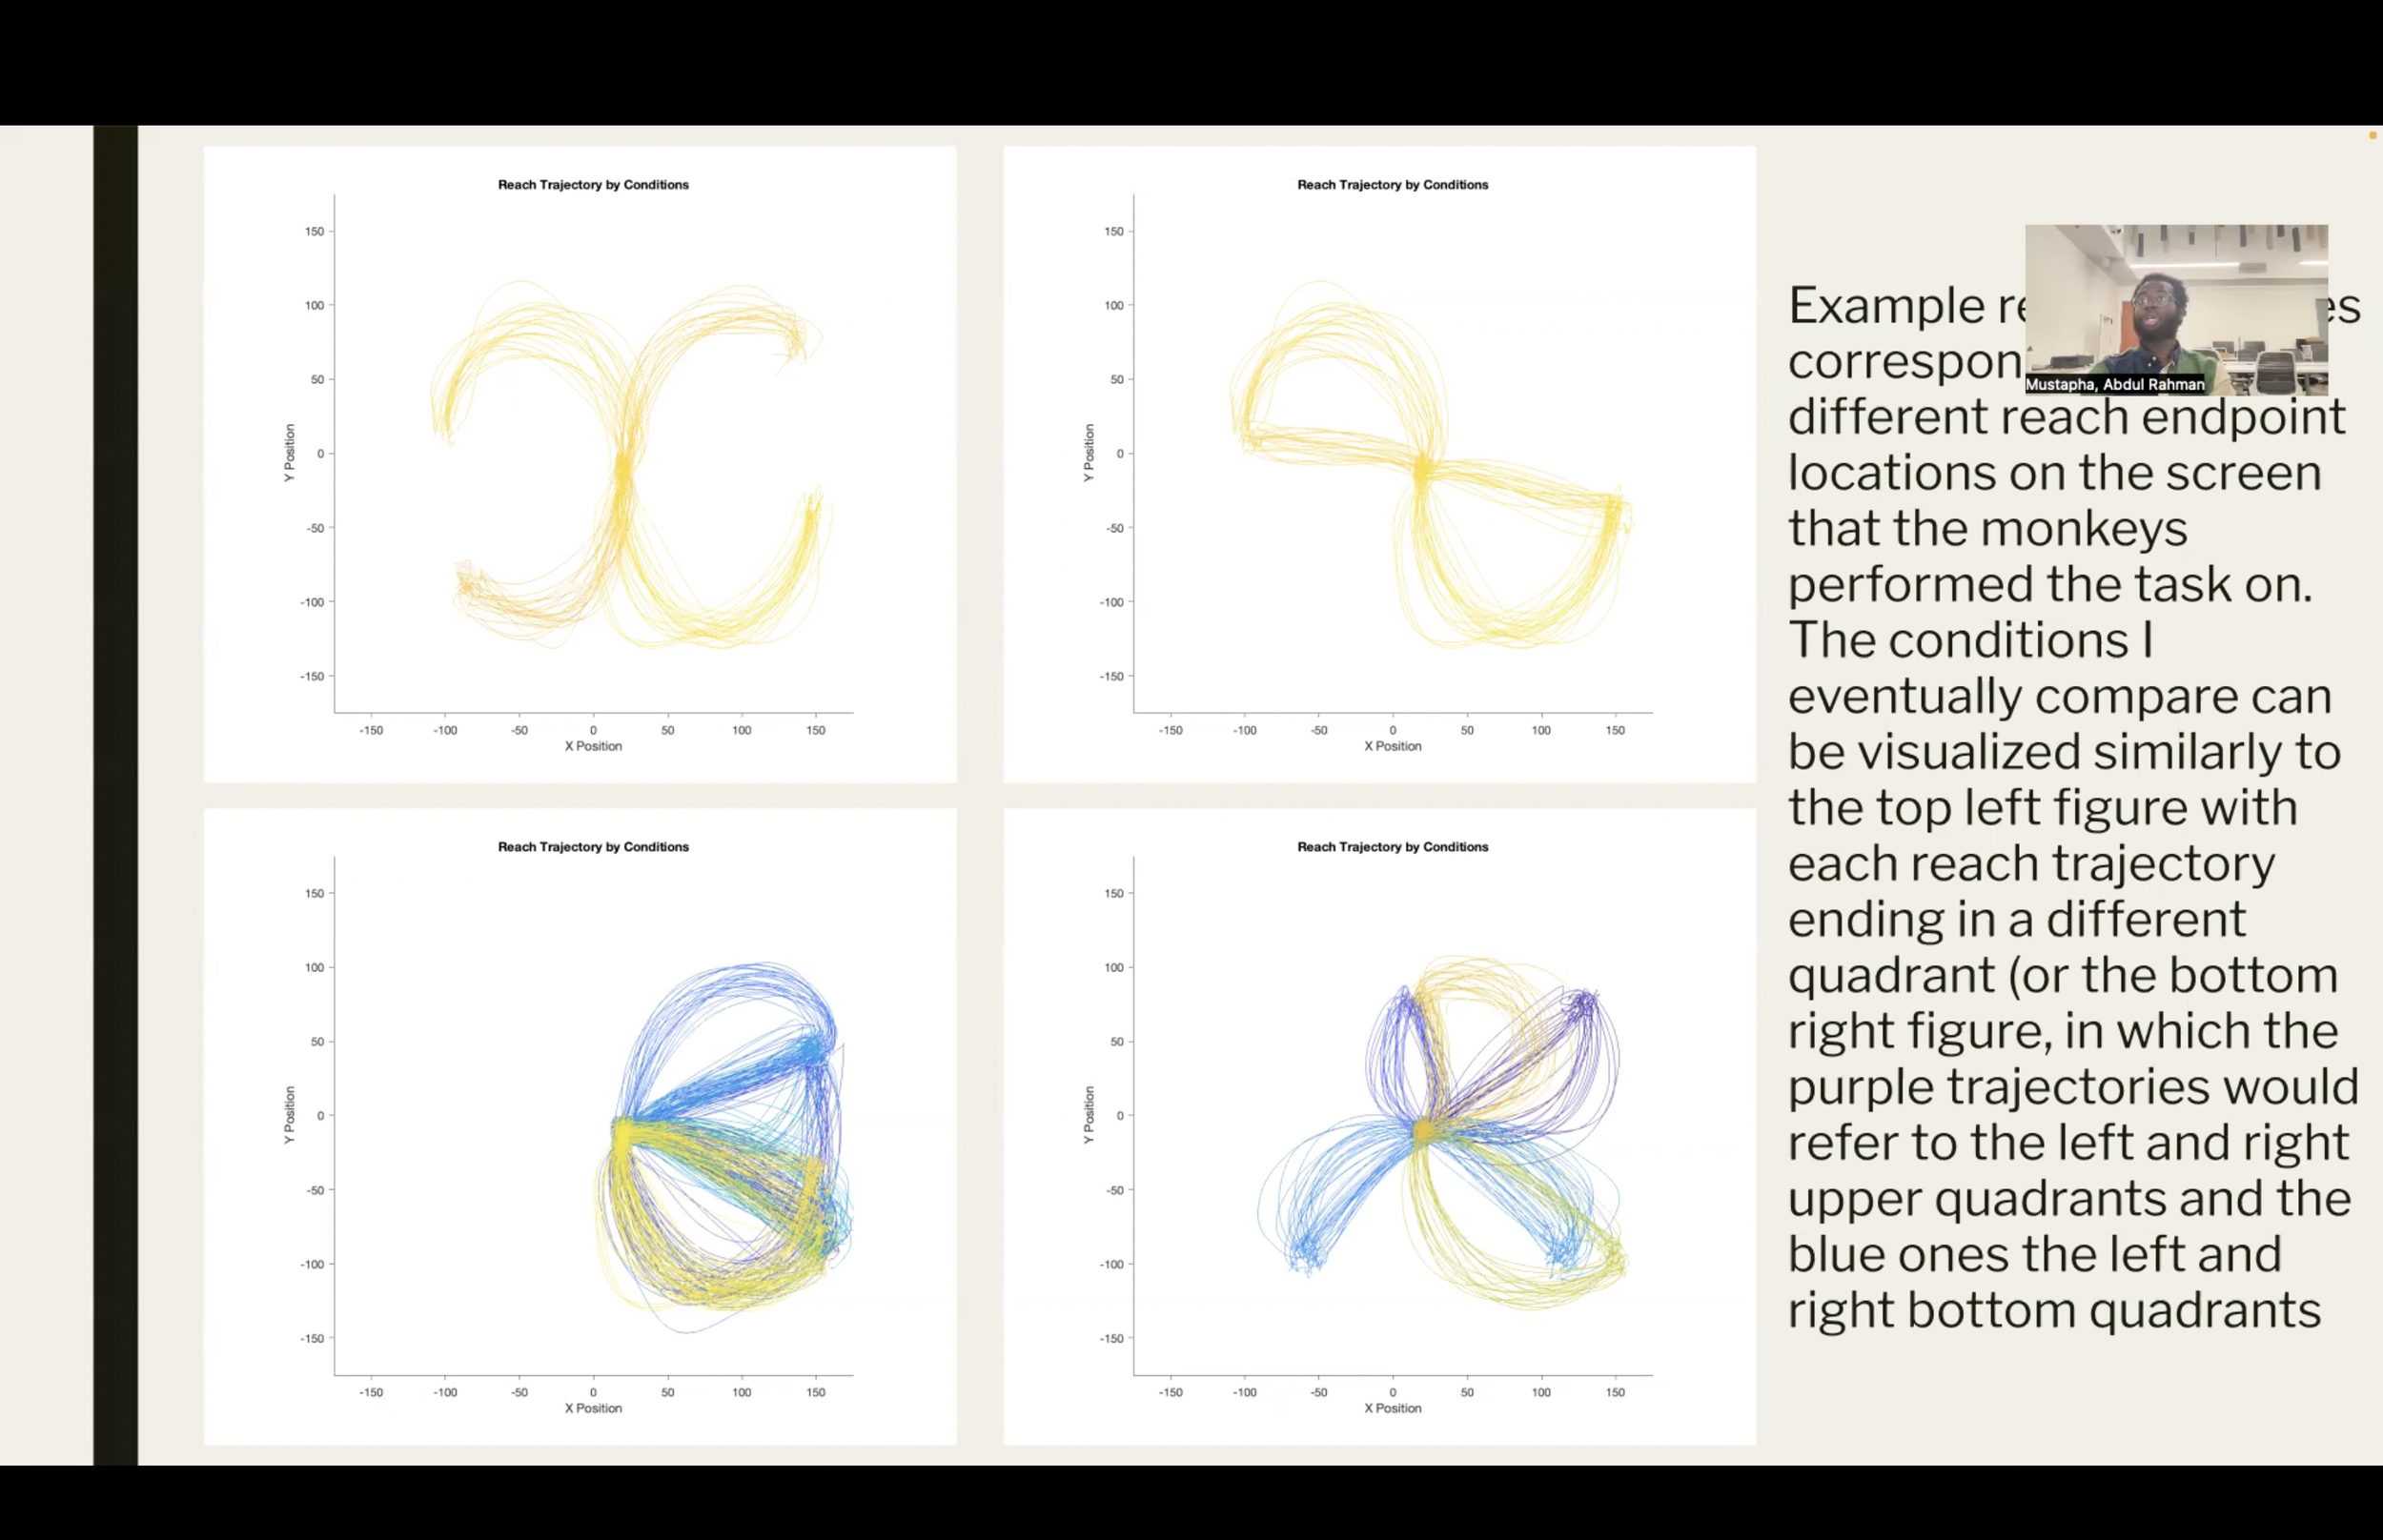
First I wanted to showcase the reaches as they look behaiorally.
I compute fano factor using rolling algorithm in which variability and mean are recalculated with each subsequent time bin. This is done across three different event types (target appearing, reach movement beginning, and reach movement ending). This is repeated for different bin sizes, 25ms and 50ms.


